

Building the new order
Written by Pablo González and Pedro Nonay, trying to know how the new world will be.
Entry 15
International agricultural flows.
January 31, 2024
You already know that I try to make each entry independent of the previous one, but that I have a common thread: I seek to deduce how the new world order is going to be organized after everything that is happening.
My new context selection.
I usually begin my entries with this “new context” heading in which I summarize the most relevant of what has happened since the previous entry regarding the evolution of the new order. My selection today is as follows:
- Elections were held in Taiwan on January 13. The result was one of continuity, and China did not like it. We will have to see what happens now (news here).
- After January 1, the entry of the countries invited to join the BRICS has been made official (except Argentina, which has declined the invitation). This will have many consequences, as explained here.
- South Africa has taken Israel to the UN International Court of Justice on charges of genocide in Gaza. The hearings began on January 11. The final outcome will take time, but it may have great consequences. Regardless of one’s views on this very sad affair, what is noteworthy is that a BRICS country is accusing a Western one at the UN, … and they are paying a lot of attention to it. They give a lot of information here. In the evolution of the matter, on January 26th that Court has made public its first resolution. It is something intermediate. It does not go so far as to propose precautionary measures, but it does speak of indications, and it says that Israel has to avoid further harm to civilians, as well as to provide information to the court. In other words, it complicates the situation for Israel in terms of international support. Paul Mason explains it very well here.
- The Houthi bombings are forcing everybody to avoid using the Suez Canal. I talk about that in the body of this entry, but it is so serious that it must be quoted here. I recommend this article.
*****
In this entry, and in the following ones, I will address the issue of major international agricultural flows. I will do so, as I have done for energy commodities, from the point of view of trying to determine the advantages or disadvantages of the West being able to be autarkic within its bloc of countries.
For this objective I am fortunate to have the friendship and collaboration of Pedro Nonay. So are the readers, given his great knowledge of the sector. It is a luxury to be able to count on his guidance in this article. My job here is to try to explain things in a way that is easy to read for non-experts, that is, to try to simplify the many things Pedro has told me. Also, I am grateful for the accurate contributions of Ivo Sarjanovic.
As a preview of the conclusions to be reached, the following graph makes it very clear that grain exports are changing destination due to the new geopolitical circumstances.
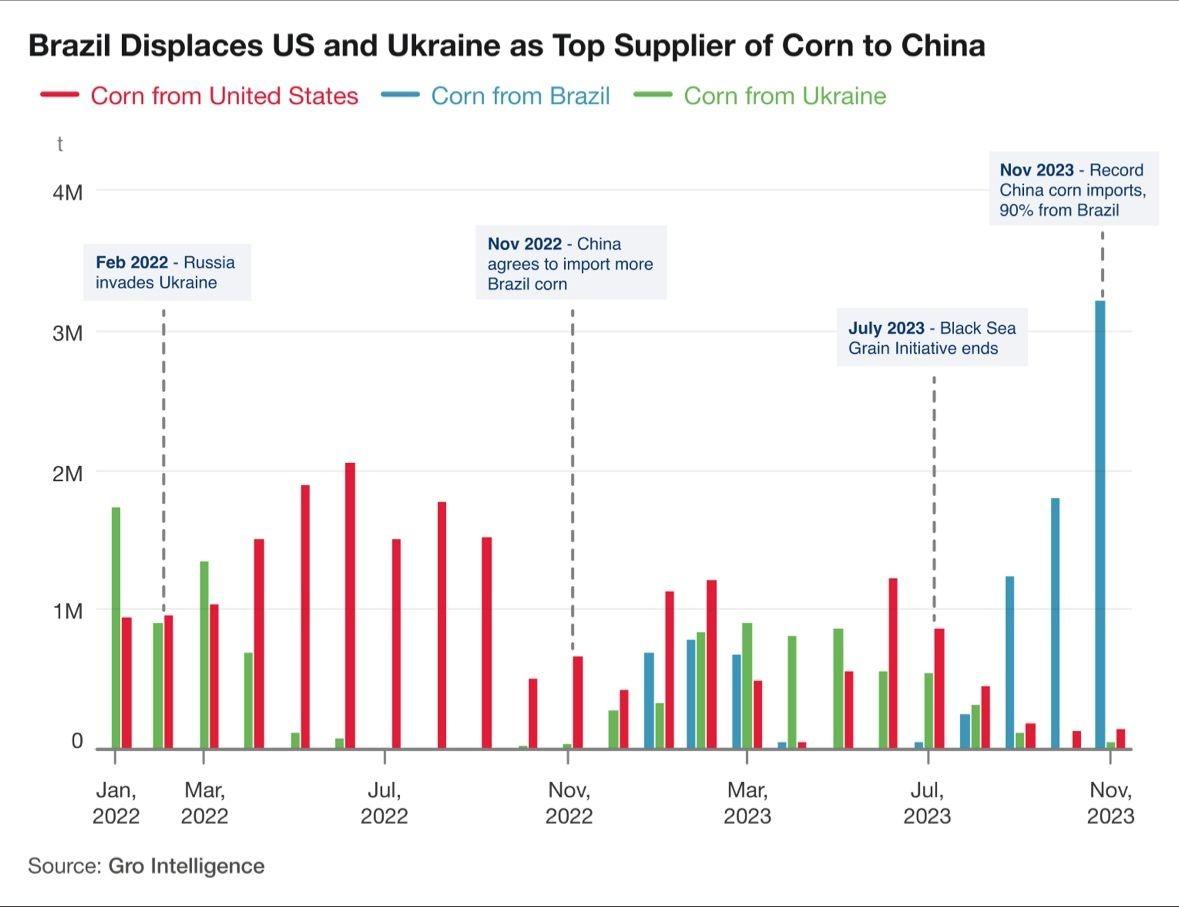
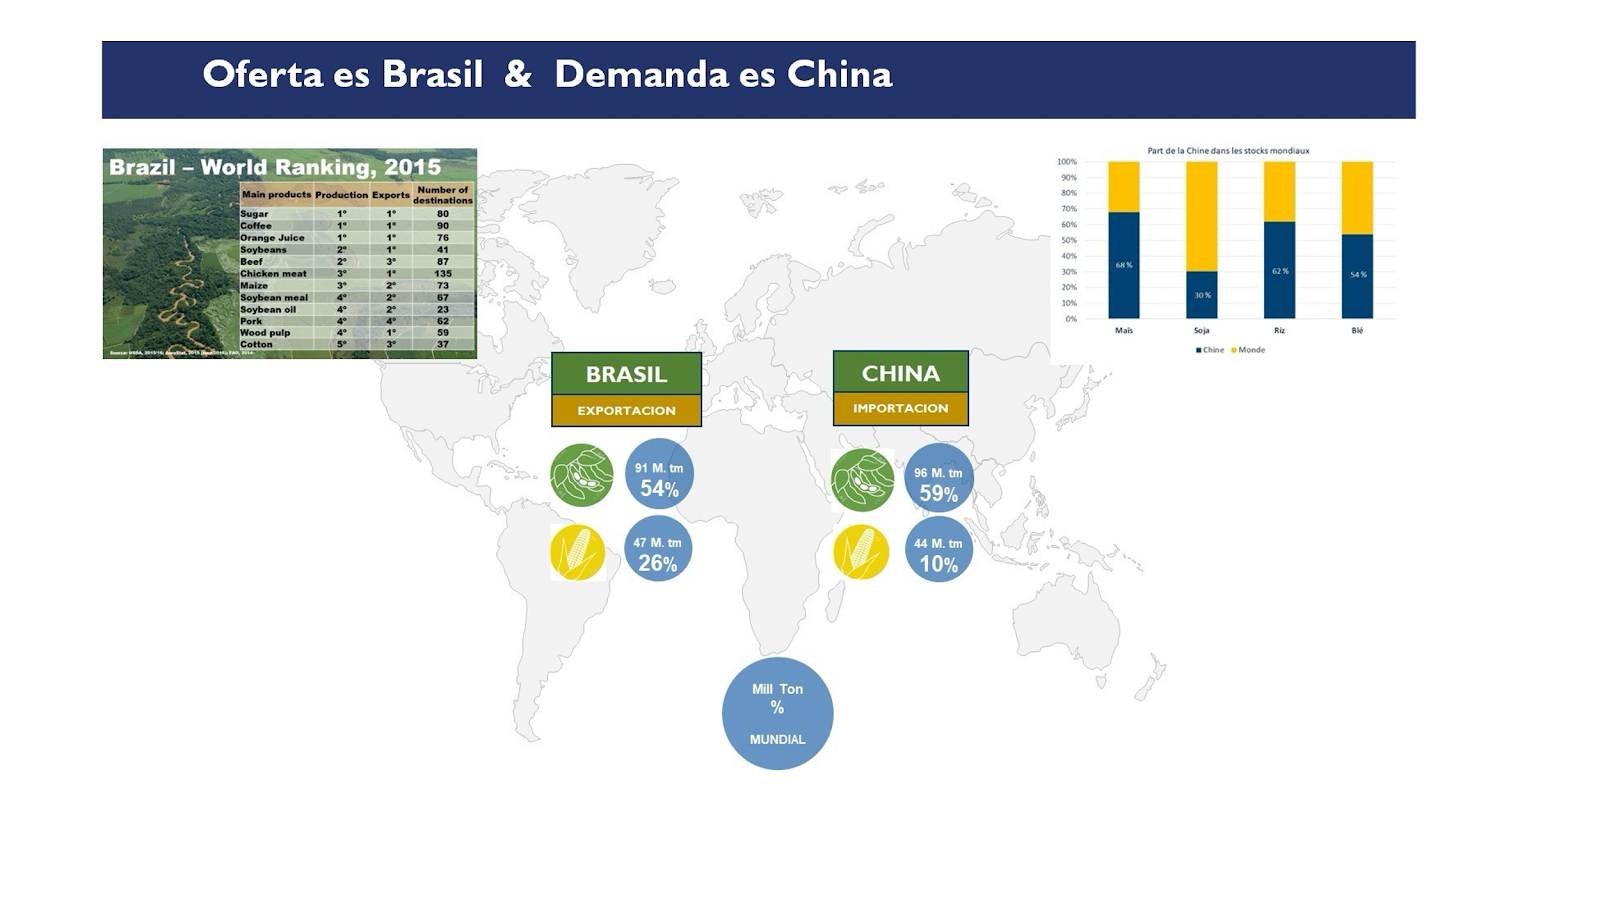
It can be seen that, before the Ukrainian war, China bought corn mainly from the USA and Ukraine. Now, however, it buys it, mainly from Brazil, which belongs to the BRICS.
However, even if the above is true, other factors that have encouraged it must be taken into account. It is the case that Brazil now has more production than before (more supply), and that China’s import licensing system has allowed it.
There have always been shifts in flows between countries. Normally, the famous “supply and demand” was a factor, but now geopolitics dictates, in many cases, from where and to where they are directed. What is new is the speed of change. This is what experts call “reshaping trading flows”.
*****
Introduction to the sector.
As this is a sector that is largely unknown to the general public, but very necessary (if crops are not properly exported, there would be more shortages and famines), it is advisable to first explain its main characteristics and rules of operation, which may imply a redesign of economic relations between countries. I will try to do so below.
Food security.
Although it would be desirable for each country to be able to grow everything it consumes on its own territory, this is not possible. Much less for all products at the same time. However, for humanitarian reasons (this is the reason why food has been excluded from sanctions between countries), a solution to this problem must be found.
In short, what they call “food security” is a way for countries to preserve their sovereignty.
Of course, climate plays a role, as different climates are suitable for different crops. The quality of the land also plays a role. There are cases of climates that are suitable for a crop, but the land is not very fertile.
And, there is the cultural issue. Logically, since ancient times it is normal that in each country traditional dishes are based mostly on products that are easier to grow in that country. It is a clear example that in China there is greater promotion of rice than in Europe.
Religion also plays a role. We will see it later in detail, but it is clear that the animals we eat are fed with feed (each animal in a different way). In countries that do not consume pork for religious reasons, they need different types of feed.
In addition, there are important conjunctural factors, such as droughts, floods, major fires, or political impositions (the hand of governments).
The issue of existing transport infrastructures, such as ports, trains, canals (Suez, Panama, …) is also very important.
There are two other issues that affect a lot. I mention them last, but perhaps they are the most important today. The first one is geopolitics. If it is true that we are heading towards a world of two blocks of countries, we will have to guarantee security of supply within our block, which will lead to reorganizing many things in the chain. The second is technology. Research may lead us to new ways of producing food, or to systems that are much more efficient in terms of yields. That will also force us to reorganize almost everything (including our habits).
All this leads to the necessary movement of large quantities of grain between countries.
As a result, the circumstances of economic development of the countries, and the correct incentives of the regulations, lead each country to have a different degree of security in terms of its population having access to sufficient food in terms of quality, quantity, and accessibility in terms of price. This is what is called “food security”. It is very important, so indexes are developed on the subject. The following summary map is very indicative:
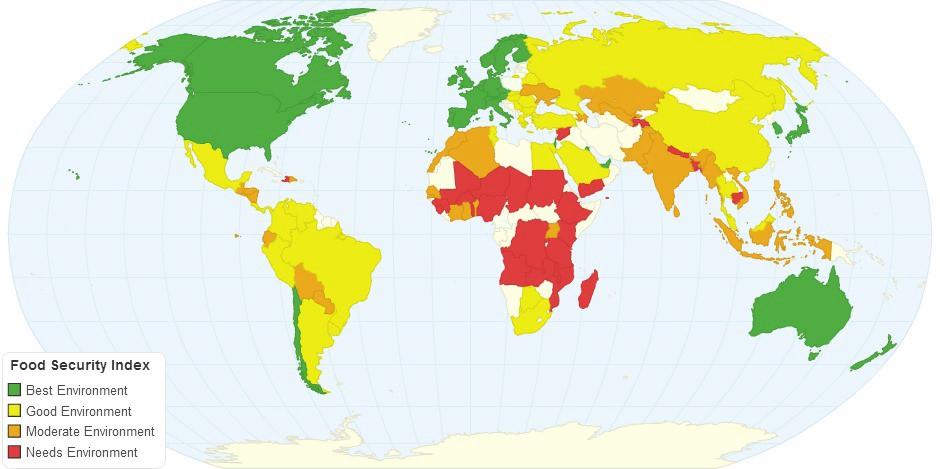
Source: Food security index.
For those who want to go deeper into this, there is data with the index for each country here. They correspond to the year 2015, which is a bit old, but the important thing is to have an overview, and for that the map and the link are valid.
One piece of good news from this map is that most of what we call the West has (today) good “food security” indices.
On the other hand, it is the developing countries that will make their own adaptation decisions and can completely change the framework. The “China case” is paradigmatic; it will have to make political trade-offs to avoid its mono-dependence on the origin of supply. In the case of fundamental imports of soybeans, it will never be able to have a trade war with the United States and Brazil at the same time, because they would literally starve to death. And being left alone with only one supplier country also entails a lot of risk.
Big picture.
In global data, approximately 20% of the entire world production of grains and oilseeds is exported/imported. In the particular case of soybeans, the ratio is much higher, reaching 45%.
To get a first idea, it is worth giving the following numbers (referring to wheat as an example). And it should be mentioned that wheat is of great geopolitical importance as it is mainly destined for human consumption.
- World wheat production in the year 22/23: approx. 800 million tons.
- World wheat exports in that year: approx. 200 million tons
- Wheat exports as a percentage of production: 25%.
- Average tonnage of grain ships: 65% is in the 60,000 ton range (I know there are many other sizes, but I’m looking for large descriptive numbers).
- To get an idea of the size, a 60,000-tonne ship would be loaded with 2,400 25-tonne trucks. If we put those trucks one after the other, we would have a row of about 60 km, i.e. almost the distance between London and Oxford.
- Average ship voyage days: 15 (if Suez, Panama, etc. are open to traffic), plus another 15 days for loading and unloading at the ports.
- Impact on logistics: For example, if maritime traffic in the Bosphorus is closed, 30% of the world flow is paralyzed.
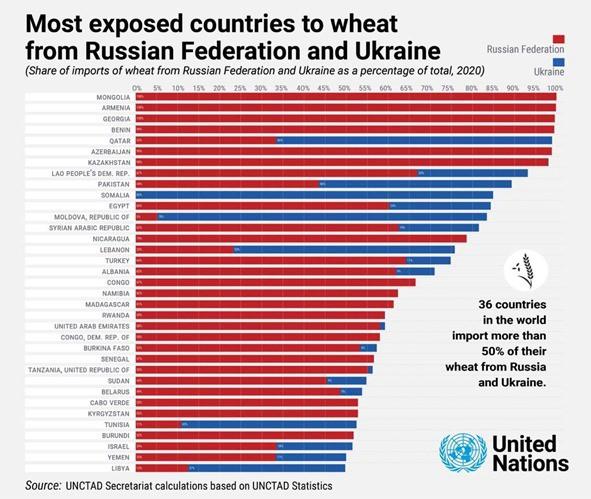
- There are 36 countries highly dependent on wheat from Russia and Ukraine, as the following graph demonstrates:
Throughout this, and subsequent entries, we will delve deeper into these figures and other crops. The objective here was to be aware of the sizes and repercussions of the sector.
A first conclusion is that, although most of the crops are consumed in the country where they are grown (there are exceptions), exports are not small in terms of numbers, nor in terms of the necessary infrastructure.
After this first “colloquial” exposition, you can see the figures in a slightly more professional way with graphs of the sector (we will use quite a few in this entry). However, I would like to point out here that we will use figures and graphs from different years and sources, since statistics are not always homogeneous and not always easy to find.
To begin with, the following graph shows wheat, corn, and barley export data for different years, measured both in value and in tons. The annual variation is significant, due to the different harvests and the amount of grain stored by each country.
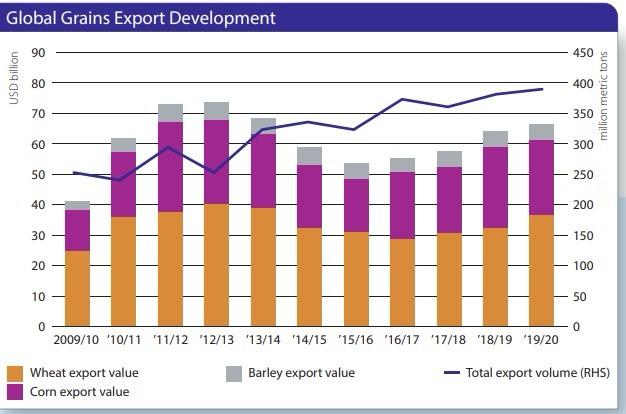
Source: Rabobank
It helps to get a first idea by looking at the summary of net figures shown in the following map:
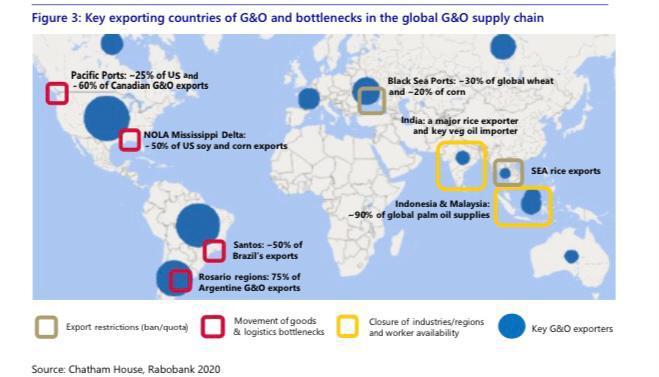
The larger size of the blue circles indicates the weight of grain and oilseed export flows in the most dominant regions. Therefore, a quick conclusion is the importance of USA, Brazil and Argentina as world exporters. On the other hand, what is marked in red refers to bottlenecks per producing country. Yellow are bottlenecks due to labour problems. And brown are bottlenecks due to political decisions. The relevance of the Black Sea for these issues is clear.
Little known issues on the street.
The truth is that those of us who do not work in the sector are not usually aware of the major issues that affect it. It is worth mentioning some of them:
- We are not aware of the way the animals we eat are fed. Both pork and chicken have their fundamental food based on corn, and their protein supply based on soy (as a comment I say that few people in Spain know that soy is important in their diet because of their consumption of pork and chicken).
Here it should be noted that not all countries feed their livestock with industrial feed, which has consequences on economic capacity and yields.
- The same thing happens with corn. We think we don’t eat much of it. But we need to know that, in addition to animal feed, many of the industrial products we buy at the supermarket are based on corn. This is the case of much of what we buy from the Kellogs brand (nachos, for example), cornstarch, and many more examples.
- We are also unaware that a significant part of the crops is used to produce fuels: biodiesel (based on oils), or bioethanol (based on corn and sugar). Up to 8% of the world’s planted area is dedicated to biofuels, replacing only 2% of the world’s oil, and they make foodstuffs more expensive, putting the food security of poor countries at risk. Exceptionally, 45% of corn and soybean oil production in the United States is used for biofuel, as is the case of Brazilian sugar.
Regarding this issue, for a long time it has been discussed whether it made sense to continue doing so, or whether it was better to produce energy on those hectares by means of solar panels. But now, with the energy crisis, this debate has been put aside and biofuel is included in renewable energies without hesitation or discussion.
- Another issue that we, normal citizens, are not aware of is the difference between market prices in international business and prices in our supermarkets. The fact is that there are political decisions, such as the CAP in Europe, and the prices fixed for bread in many places, tariffs, as well as decisions based on protection against inflation, which end up distorting prices a lot. In the following graph you can see how today we are in low moments of prices in international markets, when we all experience high inflation in supermarket prices (and always keep in mind that what is important are real prices, not nominal ones).
For the evolution of real prices, it would be necessary to follow the climate indicator, since, without problems for that reason, we have a demand that grows little (due to the slow economic and demographic growth), while the supply continues its upward trend. The only possibility of higher prices comes from subsidies for the use of biofuels.
Long term evolution of commodity prices in real terms.

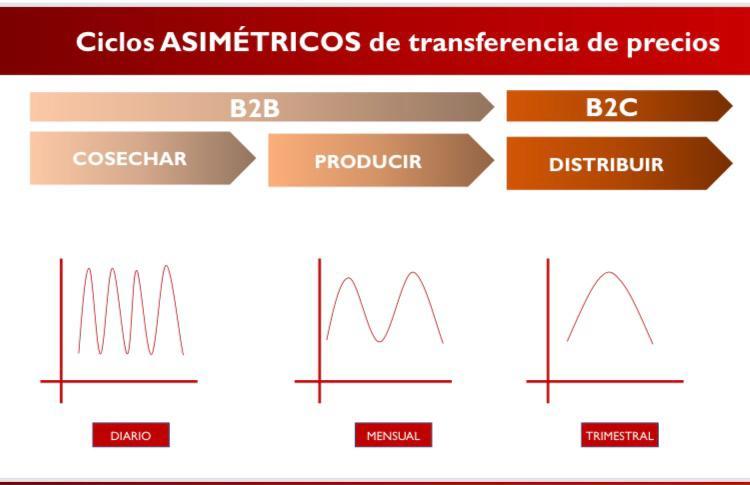
Prices are also greatly affected by the cycle of passing them from the producer to the consumer. It is a fact that what producer earns, and what consumer pays are not aligned caused on the moment they make their deal. That doesn´t mean margins, it´s just the problem of the photography of one day ignoring cicles. This can be seen in the following graph:
- Nor is the average person aware of the importance of religion in international grain markets.
The fact is that Christian countries base their meat food on pork and chicken (and beef, the richer the country is), which are fed on corn, soybean meal (for their protein supply), and feed wheat.
On the other hand, primarily Muslim countries cannot eat pork, so they place greater emphasis on chicken. This is affected by the fact that chicken needs more protein than pork. In other words, these countries need more soybean meal.
As data to be retained, the pig converts 5 kg of feed into 1 kg of meat. Chicken is 2 to 1. And, with today’s technique, 7 kg of feed is converted into 1 kg of insect.
- A very important country to consider due to the size of its population, is China. The fact is that, for them, pork is very important. There is an evolving strategic decision here: do the Chinese buy the pigs (or their products) already raised, or do they raise and feed them themselves?
- Another important country in terms of size is India. There they consume mainly rice and flour wheat (for pita bread).
- Consideration should also be given to Brazil, which is poised to double its agricultural production in ten years.
- A general idea to keep in mind is that the level of development of the country affects a lot. This is seen in the feeding of animals for meat. As it turns out that such feeding is much less efficient because the animals need much more food than they generate, the consequence is that poorer countries are “more vegetarian”.
- And, of course, in this sector the change due to new technologies is affecting a lot. There are all kinds, but I give as an example this article where they talk about the recent agreement between Elon Musk (always him) and John Deere (the great tractor manufacturer) to be able to collect yield data.
SSTU.
I have used the SSTU concept in the previous entries on the raw materials needed for the energy transition. It is also applicable here, and I develop it below.
SSTU is an acronym for:
- S, for source. In this case it refers to the type of crop and the country where it is planted.
- S, storage. As we will see, the storage capacity of each country is a fundamental grain data.
- T, transport. In this case it refers to the infrastructure for export, such as trains, ports, ships, …
- U, of use. In this case the word “consumption” would be more appropriate, but the idea is valid. It refers to where and for what purpose each type of grain is consumed.
The following chart summarizes the different stages for the sector (applied to corn) and lists the main operators.
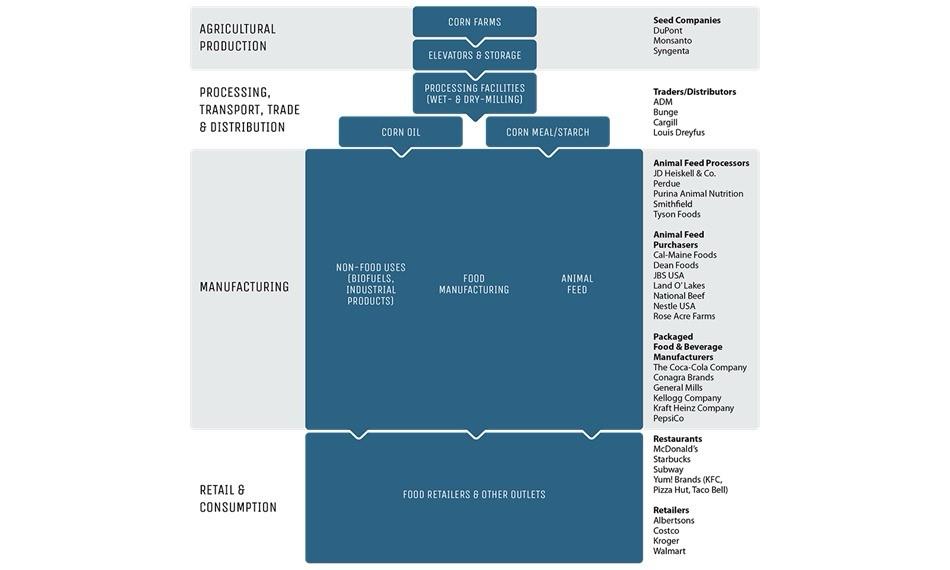
Source.
I have already said that, with the word “source”, we refer to each type of grain, and to the country where it is sown.
As for world production figures for different grains, FAO-AMIS gives us the following data, in million tons, for the 2022/23 season:
| Grain | Millions ton. |
| Corn | 1.165 |
| Wheat | 804 |
| Rice | 520 |
| Soy bean | 371 |
It is important to know that the grains mentioned in the table represent more than 90% of the total tons produced by agriculture.
Viewed by country, the result is as follows (noting that in the last two years Brazil is the country that has grown the most.
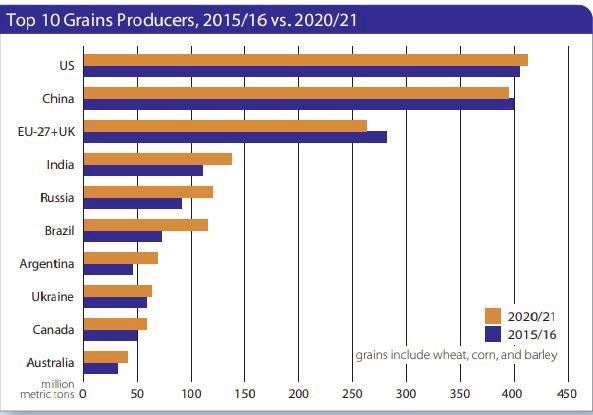
Source: Rabobank
Of course, the amount of land devoted to each crop changes over time in each country. It is still a matter of supply and demand, as well as licenses. The following graph is a good one:
Global growth in crop production
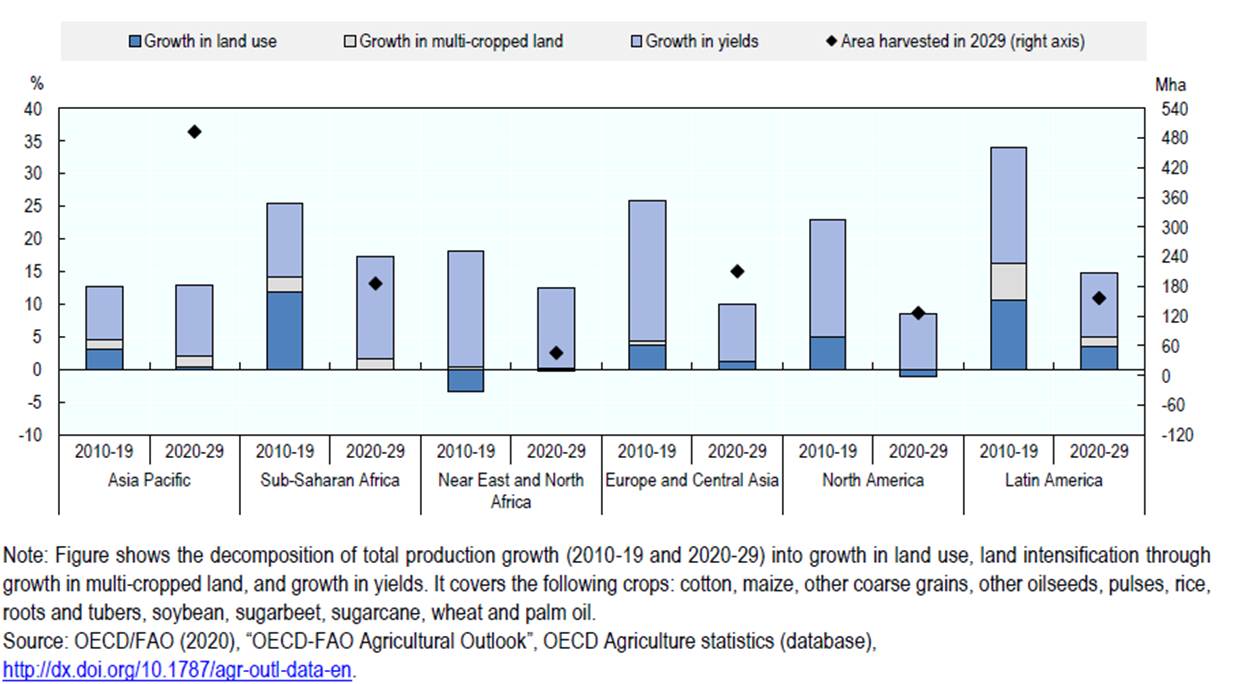
Some conclusions from this graph are:
- Significant new lands have been brought into production in South America, Asia, and Africa. And little elsewhere. Moreover, few future increases are expected (for sustainability reasons).
- Yields are improving significantly and are expected to continue to do so.
Having said that, I would remind you that what we are trying to analyze are international flows. Therefore, from the production figures of each country we must subtract what is consumed there, and what they dedicate to their warehouses. That way we would have the data on what is available for export. I will deal with this issue in the transport section.
Storage.
Most of the grains and oils of large production have the great advantage that they take a long time to spoil for consumption. This is not a coincidence, but the result of a historical process in which different food alternatives that could be preserved without technology (no refrigeration, electricity, …) until the next harvest were tested.
Therefore, they can be stored for long periods of more than one year.
This leads many of the countries (for food independence) to have a national storage strategy to be able to supply their population until the new harvest arrives. As well as to know in time if they will need to import before the new harvest.
Knowing the expected consumption and the quantity of each product in stock, each operator knows the number of days he has guaranteed for that product. With this information, it makes its import or export decisions. These operators will be public or private, depending on whether they are countries with a state-owned market or a dominant free market.
Without being an absolute rule, it can be said that, in places where there is a policy of food independence, when there are less than four months of reserves left (and the new harvest is not expected within that period), purchase or import orders are activated.
Graphs such as the following are quite descriptive.
World wheat
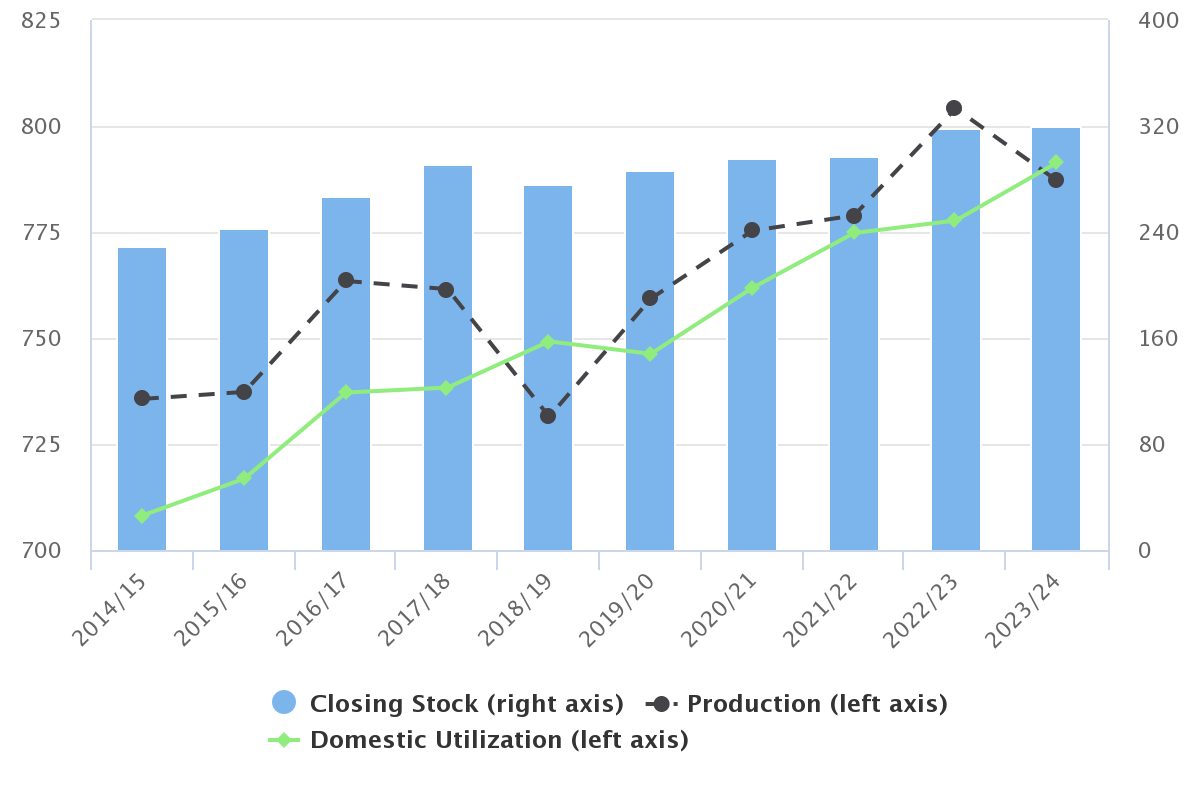
Source: Fao/Amis
In this case it is for wheat worldwide. We can see that the latest harvests (black line and left axis) are in the range of 800 million tons. The green line is what is consumed (worldwide), and it is almost always close, but somewhat lower than what is produced.
The blue bars (and right axis) are the storage, which is ultimately in the range of 320 million tons. This indicates that it is slightly less than half of what is produced/consumed annually. In other words, there is enough storage for a little less than half a year. However, it should be noted that most of the stocks are usually in China and India.
As the graph, in this case, refers to the whole world, if the produced is greater than the consumed, the difference is for more storage. If it were the graph for a single country, that difference could be for export, or for more storage.
Transportation.
Following the SSTU model, the T refers to transport, i.e. export/import.
Exports, in addition to the negotiations between the participants and the large economic movements, logically involve the physical movement of large quantities of grain.
This movement of grains requires large infrastructures, such as specialized ports, trains, trucks, loading and unloading systems, large bulk carriers ships, …
Given the low price per ton of grain, these costly infrastructures have to be highly optimized in design so that their use does not make the price of grain too high. And they have to be operated for the entire amortization period. This issue makes it very complicated to suddenly change the main grain flows.
This is the example of what has happened with the Ukrainian War. Ukraine is a traditional exporter. With the War, Ukrainian ports could not be used to get grain out, because navigation in the Black Sea was not safe. But there was no “substitute” producer. As a result, the grain was spoiling in Ukrainian silos. The operators in the sector had to do “magic” to find solutions, and everyone knows that prices were hit hard for a while.
What is easier to change are the routes of the ships. However, this also has its effects. If ships must sail longer routes, more total “ship days” will be needed. As the year has the days it has, and the fleet is designed for the current needs, we find that there will not be enough ships to cover the needs (and new ships are not built in a matter of days, … or months). Logically, this implies increases in the price of the ship (which are passed on to the grain) as well as some unsatisfied needs (it will be necessary to manage the reserves very well).
Examples of such problems with ship routes we have seen when the Black Sea was blocked, also when in the summer of 2021 the ship Evergiven got stuck and blocked the Suez Canal. And, at the present time, the Suez Canal is also experiencing the elimination of traffic due to the bombing of ships by Yemen’s Houthi rebels.
We also saw examples of this for another cause. It is when the Covid in China forced very low activity in the ports (due to lack of workers). At that time, the waiting time for loading and unloading of ships near the ports took forever (more than usual, because port congestion at the beginning of the harvest is normal), which had the same market-distorting result.
In addition, there are the more natural, but equally distorting, causes. It is currently happening in the Panama Canal. It turns out that the mix of drought and vegetation growth in Gatun Lake (the man-made lake in the center of the canal) is preventing the same number of ships from transiting the canal as before. This lake is used for “queue management”, and now there is less room for ships. The result is that today 24 ships per day are transiting the canal, when the design capacity is 38 (news here). Significant percentage decrease.
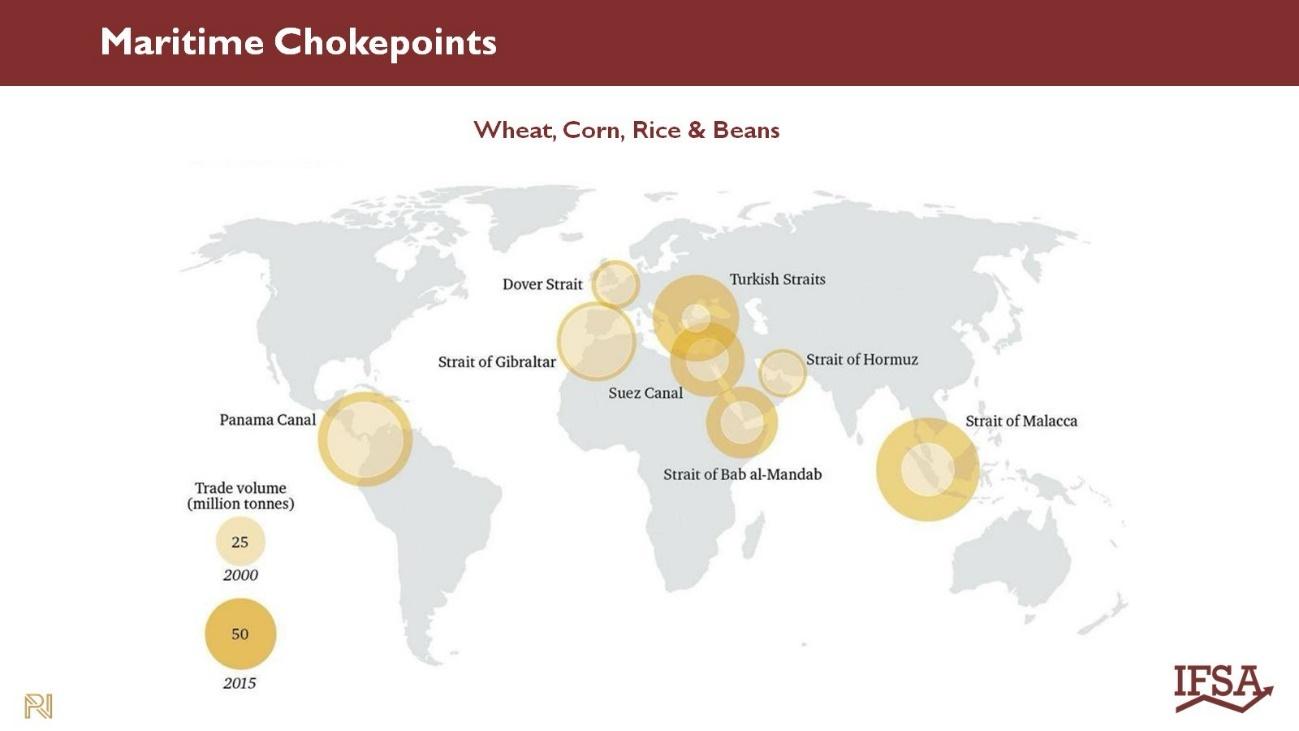
The following map summarizes the “bottlenecks” for navigation and their tons of traffic at stable times (stability is becoming less and less common).
Regarding the types of grains that are most exported, the following chart tells us that they are mainly wheat and corn, and some rice.
Global cereal trade volumes by commodity

In addition to grains, it is important to look at oil exports. The following chart summarizes them by type of oil and exporting country. It is clear the importance of Brazil and Argentina in this aspect.
Share of exports in total productioin of oilseed products for the top three exporting countries

One last issue I want to mention in this section on exports is that of demographics, since it affects so much. According to the UN, major demographic changes are predicted, with a relatively early peak at 10 billion people in the world, and a rapid decline thereafter. However, there are many experts who have doubts that this number will become a reality, and it seems to them that the large population growth is already slowing down.
The fact is that, if demographics change faster than the construction period (and the amortization period) of the infrastructures to serve them, we are going to have a problem (news here).
A general summary of the situation is that Asia and Africa lead the demand for imported grains and oils, and that the two Americas (South and North) are the leading exporters (news here). This is further summarized in the following graph:
Crop uses.
It is very interesting to see the final destination of the crops. And to realize that it is not exclusively for direct human consumption.
A large part is used to feed livestock. It is still final human consumption of meat or milk, but in an indirect way, and losing yield in the process.
It is also widely used to produce biofuel.
And there are other uses, such as aesthetic products, …
In addition, new technologies, such as artificial meat, must always be taken into account. For now, it seems that this will not be relevant in percentage terms in the short term, but it may be in the long term.
The following graph shows the small proportion of corn destined for direct human consumption (the part in dark blue). The growth projections for 2029 are also shown.
Global use of major commodities

With all the above I have tried to explain a little of the basics of this sector that manages the great international agricultural flows. In the following entries we will deal with each type of grain individually, and we will look for the situation of the West in order to organize its possible autarky.
*****
That’s as far as I’ve gone for today. In the next entries I will continue with agriculture, in this case, analyzing crop by crop.
As always, I welcome comments on my email: pgonzalez@ie3.org